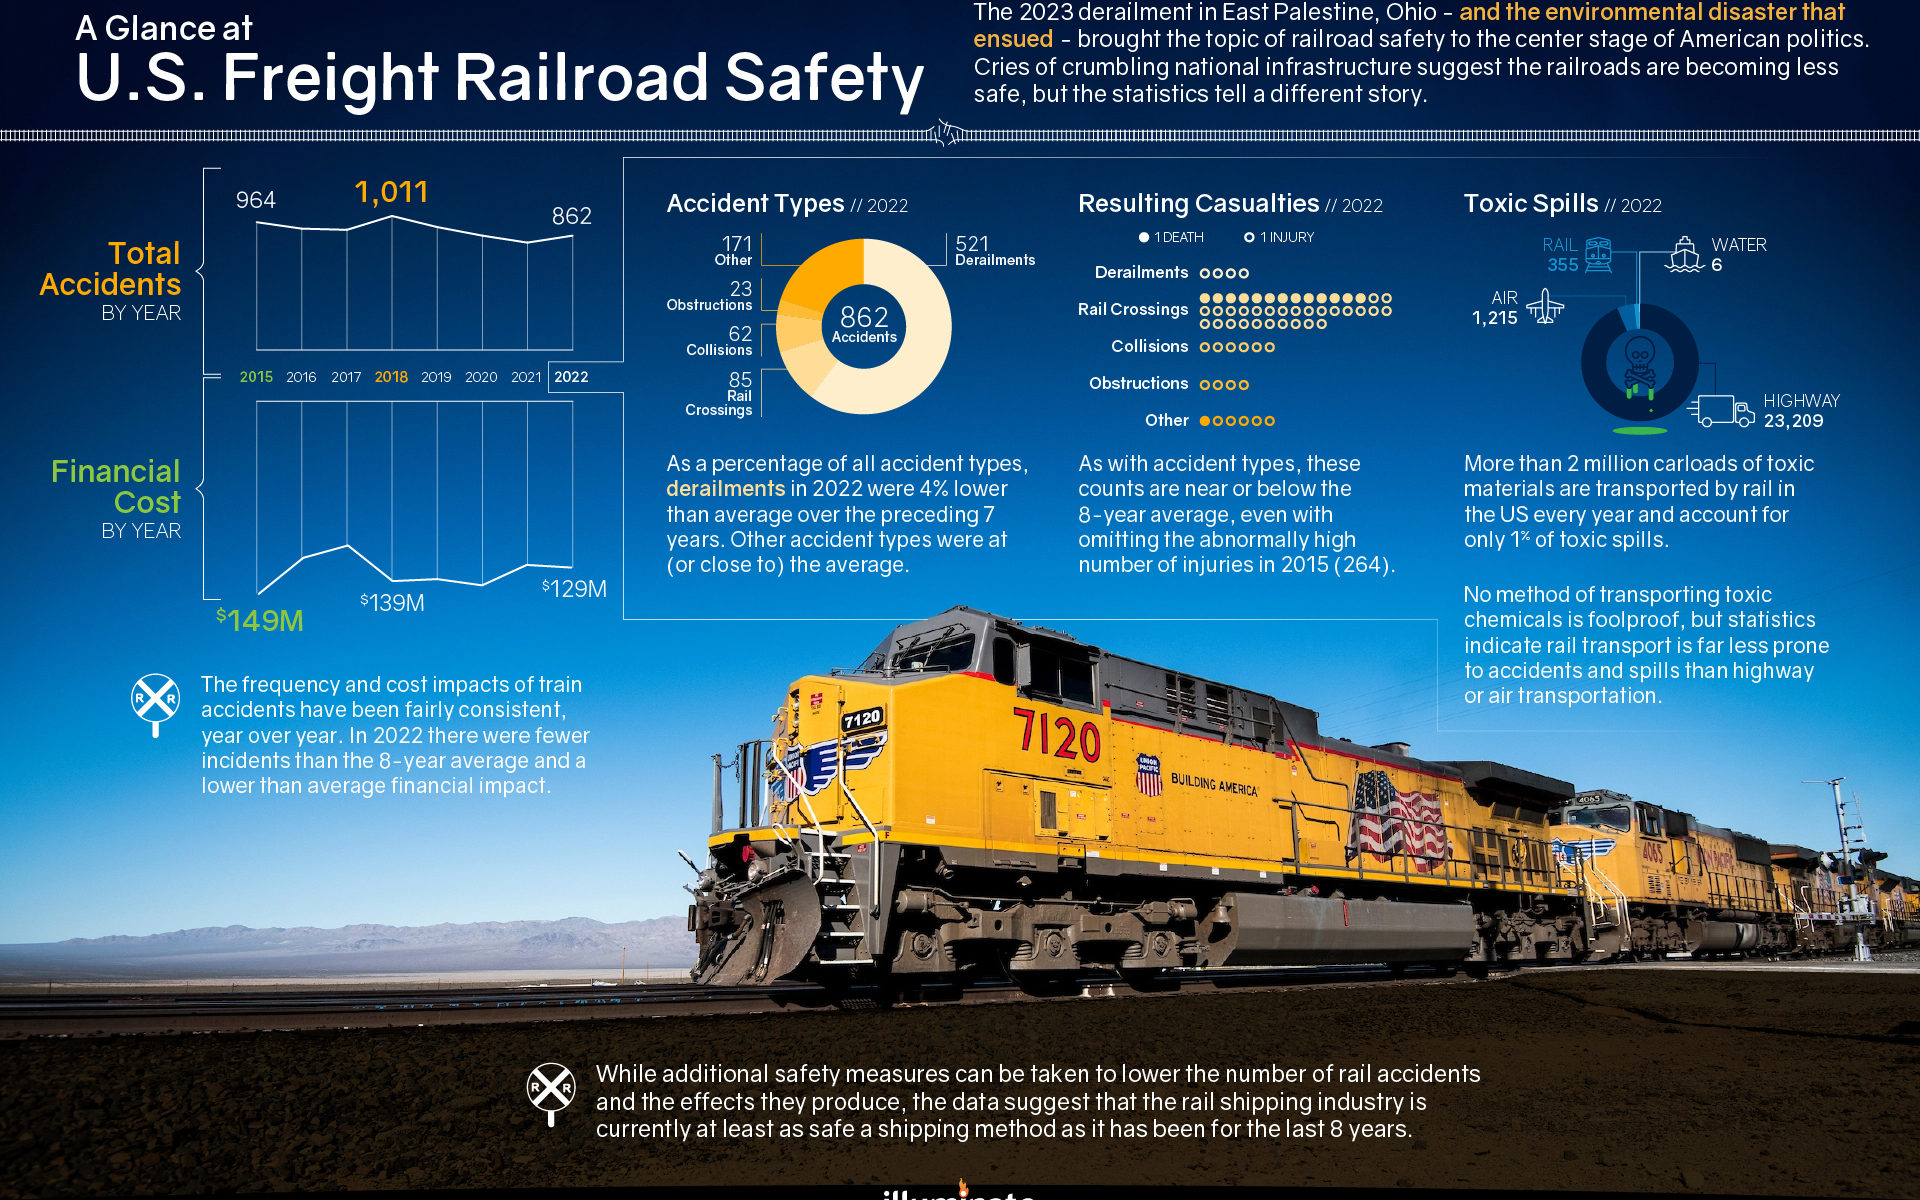
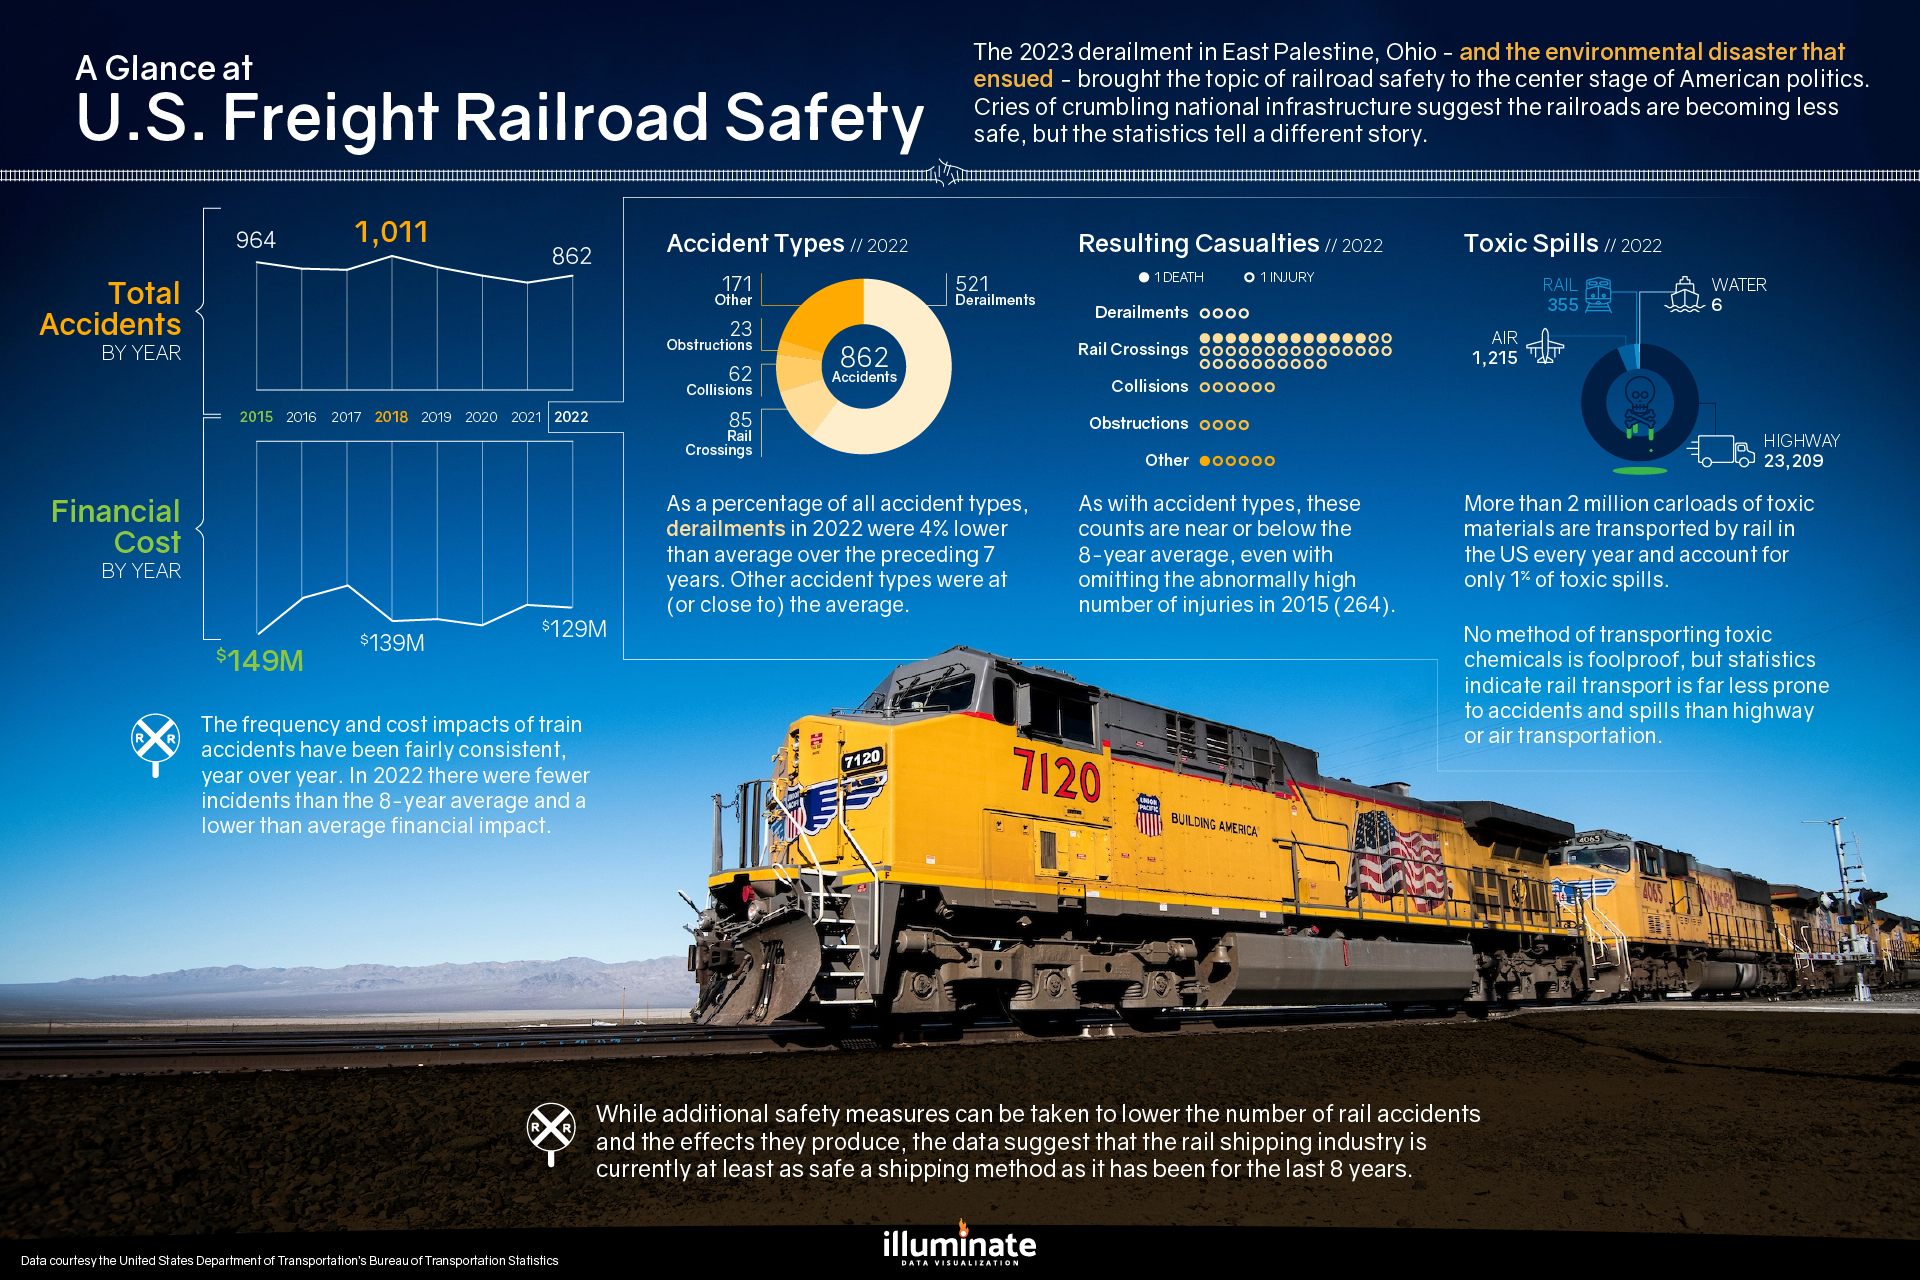
The 2023 derailment in East Palestine, Ohio – and the environmental disaster that ensued – brought the topic of railroad safety to the center stage of American politics. Cries of crumbling national infrastructure suggest the railroads are becoming less safe, but as shown in the nearby infographic, the statistics tell a different story.
This concise – and beautiful – infographic conveys trends in railroad accidents since 2015, a breakdown of the causes and related casualties, and the financial impact of such incidents. It also compares the statistics of toxic spills, by type of transportation. The data show that while improvements can always be made to enhance safety and reduce accidents, freight rail continues to be a statistically safe means of transportation toxic materials.
Did you enjoy reading this infographic? See more Illuminate infographics here!
Data courtesy the United States Department of Transportation’s Bureau of Transportation Statistics.


